Sunday 31 December 2017

Types of leases Finance Lease, Operating Lease and Sales type lease

A simple table to understand the difference between various types of leases


CAPITAL LEASE
(i) FINANCE LEASE

In a finance lease, a leasing entity (the lessor or the owner) buys the asset for a user ( the lessee or the hirer), rents it to the user for an agreed period. The user pays a rent periodically for the usage of the asset. The payment terms are all according to the lease contract.  A lease is considered to be finance lease if:-
Either

The present value of all future rent payments is more than 90% of the FMV of the asset at date of lease inception 
                           
 Or
The lease is for more than 75% of the life of the asset
Or
The lease agreement allows the transfer of ownership to the user at the end of the lease term
Or
The lease agreement allows for a bargain purchase of the asset for the user at the end of the lease term.
The basic difference between a finance lease and an operating lease is that the asset is shown in the users balance sheet in a finance lease vis a vis an operating lease where the asset is shown in the owners balance sheet. Mind you, in both types, the owner legally owns the asset. Technically, the owner transfers substantially, the risks and rewards of the ownership to the user in case of the finance lease.
Why is it called a finance lease? The owner expects an interest on the leased value of the asset. The user will pay equated installments of lease payments, which will have a principal component and an interest component. The equated installments will be calculated using a target rate of return agreed  by the owner and the user. Whereas, in an operating lease, the profit for the owner comes from the rent payments and the resale value of the asset.
Now let us see an example

A leasing firm leases a machine to a user for 4 years starting January 1st of the year. The cost, as well as the transfer price is the same $ 50000. The first lease payment is immediate, on January 1st itself, with 3 more lease payments expected. The machine has an estimated life of 4 years. The owner expects a 10% return on his lease.
Here the equated lease installment amount is calculated as 50000/present value of annuity due. 10%, 4 periods
=50000/3.487
=$14339
If we multiply 14339 into 4, we get $57356. Therefore the owner makes a profit of $7356 throughout the lease term, which is the interest part.

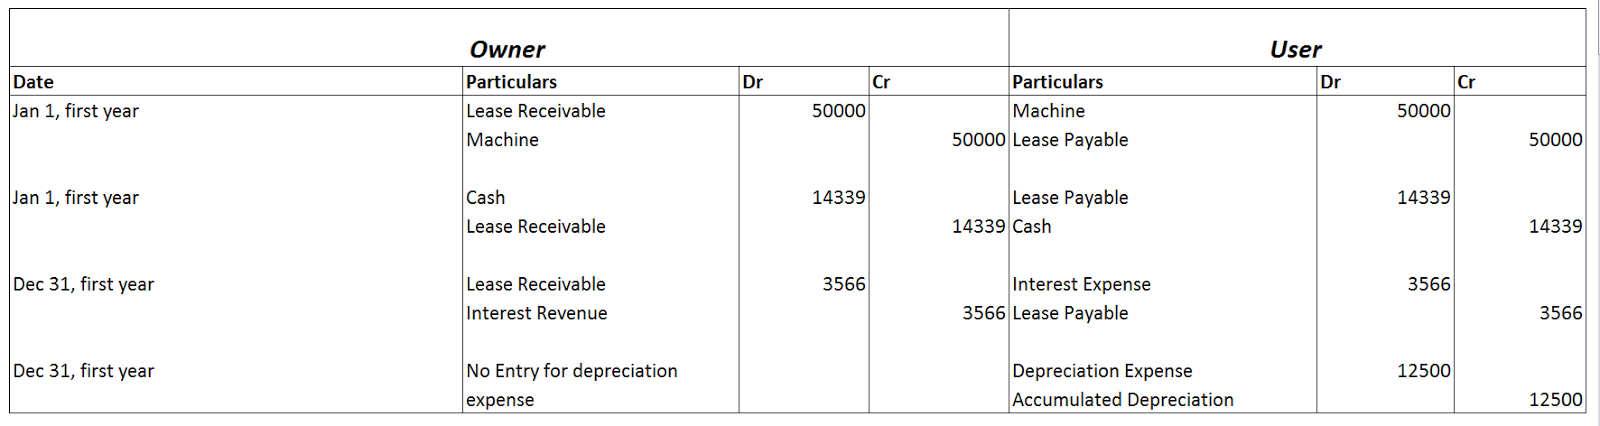
 The accounting entries are.

Now let's see the amortization table. 

For finding the interest for the year, we use the 10% target rate of the owner. Since the first payment is received early in the year, the interest at the end of the year is (50000-14339) x 10%


So the profit of $7358 for the owner purely consists of the interest on the lease outstanding at his target rate of 10%

(ii)SALES TYPE LEASE

In simple words, a sales lease is only a finance lease, except the owner makes an initial profit over the cost of the asset when the lease starts. In other words, the lease amount is greater than the cost of the asset. It can also be said that the present value of all the future payments will be greater than the cost of the asset.

Let us look at the earlier example:

If the transfer price is set to $60000, that is $10000 more than the cost price of $50000

The accounting entries are


How did we get the figure of $17207 as the lease installment amount? Though the owner recognized a gain of $10000 in the accounting entry, it is a non cash gain. Where does he finally realize the cash of $10000 gain? It is along with the lease installments.

Here the equated lease installment amount is calculated as 60000/present value of annuity due. 10%, 4 periods
=60000/3.487
=$17207
If we multiply 17207 into 4, we get $68830. Therefore, the owner makes a profit of $18830 throughout the lease term, which is the interest part plus the profit of $10000.

 It will be much clearer if we look at the amortization entries.


So the profit of $18830 for the owner purely consists of the interest on the lease outstanding at his target rate of 10% plus the profit of $10000


OPERATING LEASE
In an operating lease, same as the capital lease, a leasing entity (the lessor or the owner) buys the asset for a user (the lessee or the hirer), rents it to the user for an agreed period. The user pays a rent periodically for the usage of the asset. The payment terms are all according to the lease contract. The difference is that:
1.    The lease term is considerably less than the life of the asset so that the asset retains a resale value at the end of the lease term
2.    The owner makes profit from the rent revenue stream. He may re-lease it to different parties at the end of each lease term. He may get good resale value too, once he is done with leasing.
3.    The asset remains in the balance sheet of the owner. The owner has to ensure that the resale value of the asset is not affected by use. The material risks and rewards lies with the owner.
This residual value is forecast at the start of the lease and the owner takes the risk that the asset will achieve this residual value or not when the contract comes to an end.
An operating lease is more typically found where the assets do have a residual value such as aircraft, vehicles and construction plant and machinery.  The customer gets the use of the asset over the agreed contract period in return for rental payments.  These payments do not cover the full cost of the asset as is the case in a finance lease.
Operating leases sometimes include other services built into the agreement, e.g. a vehicle maintenance agreement.
Ownership of the asset remains with the user and the asset will either be returned at the end of the lease, when the leasing company will either re-hire in another contract or sell it to release the residual value.   Or the user can continue to rent the asset at a fair market rent which would be agreed at the time.
Let us consider an example
A leasing company leases a machine for an agreed upon yearly rent of $5000. The cost of the machine for the owner is $12000. The lease period is for 3 years. The agreement starts on Jan 1st of the year. The rent payment is expected at the beginning of the next year on wards.
Accounting entries are

If the owner had insisted on prepaying the whole rent at the beginning of the year itself
Accounting entries are.


Tuesday 22 August 2017

Net interest Margin, Leverage and Capital Adequacy Ratio

Net interest Margin is one of the major parameters used in assessing the performance of a finance company


NIM = Net Interest Income / Asset(i)

= (Interest Income – Interest Expense)/Asset

= (Lending Rate X Asset – Borrowing Rate X Debt)/Asset First Formula

= Lending Rate – (Borrowing Rate X (Debt/Asset)) Second Formula

=Lending Rate -(Borrowing Rate X(Debt/Equity X Equity/Asset)

=Lending Rate -(Borrowing Rate X Leverage X Capital Adequacy Ratio) Expanded Formula

(i)  Please note that Assets here are the loans made by the finance company and not other assets.


Monday 21 August 2017

How to Value the stock price of a Housing Finance NBFC

The HFCS in India catering only to sub prime housing loans must be valued at and only at the future growth prospects of its earnings, provided they have similar ROE/ ROA and NPA levels compared to their peers

When we value the price of a company's share, in the stock market, the parameters that comes to mind are P/E, P/B. ROE, ROA etc

So how do we value a finance company that primarily deals with housing loans catering to subprime category in India.

The subprime housing loan sector is one of the fastest growing in India. In India, unlike in most developed countries, people usually live in their mortgaged property rather than treating the property a trade commodity. As people do not like to lose their home in which they live, they tend to not to default on their loans. Therefore, the NPA for housing finance companies dealing with sub prime mortgage lending is much lower, when compared to other finance companies.

A typical sub prime mortgage HFC, has an average LTV ( loan to value ) of 70%. Thus the customers are required to put up 30% of the consideration as down payment. This also forces them to treat the loan seriously, unlike what happened in the US sub prime mortgage crisis, where more LTV reached more than 100% at one point.

According to estimates only 15% of the population in India are salaried, 35% non salaried, and rest 50% wage earners. Thus the HFCs which have 50% non salaried customers have a huge untapped market.  This lets them grow their loan book at a rate of more than 20%. Their ROE/ROA is also much higher than other Finance Companies.

Since their earnings also grow rapidly, and have a future predictable growth in earnings, the HFCs are typically values based on their P/E than the P/B multiple.

Normally a finance institution is value based on its P/B ie Price to Book value of Equity. But in case of HFCs, the P?B multiples typically are quite higher.

Why?

Let us examine the ROE

ROE=Earnings/ Book value of Equity
P/E = Price / Earnings

So ROE X PE = Price/ Book value of Equity

So P/B=P/E X ROE

Now we can see that, assuming ROE to be constant, P/B will only depend on P/E which in turn depends on the prospects of future earnings. Since the HFCs PE multiples are valued similar to FMCG companies due to their predictable future earnings growth, PE tends to be very high when compared to other finance companies. 


Another way to value an HFC is Market Cap/ AUM multip


AUM is assets under management

So MCap/ AUM = Price per Assets ( Here other assets are considered insignificant )

= P/A

=P/E X E/A
=P/E X ROA

So again we come to P/E multiple if we consider similar ROA companies.


Sunday 19 March 2017

Cost of goods sold for a manufacturing company

We know that the basic formula for COGS is

 COGS = Cost of Goods Available for sale-Closing Stock 

 Cost of Goods available for sale.= Opening stock + Purchases

The concise formula therefore is

COGS = Opening stock + Purchases - Closing stock.


But this formula is so basic that it can be applied only to a trading company where nothing is manufactured.

Why?

Because manufacturing company has to account for Raw materials consumed, Work in Progress, Manufacturing over heads such as electricity, fuel, salaries and wages,stores and spares consumed.  transport to warehouse, etc. Also the company may purchase and sale stock without manufacturing it.

The formula of COGS for a manufacturing company is

Formula No 1

COGS = (1) Cost of Raw materials consumed 
           + (2) Purchase of Stock in Trade 
           + (3) Opening stock of WIP 
           + (4) Opening stock of finished goods 
           + (5) Opening stock of stock in trade
            - (6) Closing stock of WIP
            - (7) Closing stock of finished goods 
            - (8) Closing stock of stock in trade 
           + (9)  Manufacturing overheads 
           + (10) Cost of Stores and spares ( including packing materials) consumed
           + (11) Stock adjustments due to mergers and acquisitions 
           + (12) Other adjustments.

Formula No 2

COGS       = Cost of stock in trade sold + Cost of finished goods sold + Cost of Stores and spares ( including packing materials) consumed + Other adjustments.


Most of the balance sheet for Indian companies use the first formula, so that they can represent all the cost components of manufacturing separately.

So, if I am able to start from Formula 2 and slowly expand and reach Formula 1, my mission will be complete.

Now for simplicity sake, let us ignore the Cost of stock in trade sold, Cost of stores and spares (including packing materials consumed) and Other adjustments and focus on Cost of finished Goods only, because, majority of the components of Formula No 1, is present in the Cost of finished goods.

Now before we go further, we need to make a primary assumption, a kind of visualisation, of how the  journey of finished goods, from the purchase of raw materials to the final finished state happens.

For this purpose, we need to imagine that the manufacturing process happens in 3 stages in 3 separate areas of the same building as seen in the image below.


THE FINISHED GOODS AREA


In order to fully understand the concept let us begin at the finished goods area.

In the finished goods area, we manufacture the finished goods, stock them and then sell the finished goods according to the demand from the market.

By using the general formula for COGS, and a bit of thinking, we can accept that the Cost of finished goods sold is

Cost of finished goods sold = Opening stock of finished goods + Cost of manufacturing of finished goods -Closing stock of finished goods. (FORMULA A)

What we need to understand is, what all adds up to the cost of manufacturing of the finished goods.

In the finished goods area, we take the necessary WIP stock from WIP area, use necessary equipments, consumables, fuel and labour to convert WIP to finished goods, which then adds to the finished goods stock.

Cost of manufacturing of finished goods = Cost of WIP used + All the manufacturing overheads for converting WIP to finished goods. (FORMULA B)


THE WIP AREA


In order to find the Cost of WIP used, we need to understand what is happening in the WIP area.

In the WIP area, we source raw material from the raw material area and convert the raw material into WIP, add to the WIP stock and transfer the necessary WIP to the finished goods area.

By using the general formula for COGS, and putting a little spin on it, we can accept that the Cost of WIP used is

Cost of WIP used = 

Opening stock of WIP + Cost of conversion of Raw Material to WIP - Closing stock of WIP. (FORMULA C)


Now let's see, what all adds up to the cost of conversion of Raw materials to WIP.

In WIP area, we take the necessary raw material from raw material area, use necessary equipments, consumables, fuel and labour to convert raw material to WIP, which then adds to the WIP stock.

Cost of conversion of Raw Material to WIP = Cost of Raw material consumed + All the manufacturing overheads for converting Raw material to WIP. (FORMULA D)


THE RAW MATERIALS AREA


In order to find the Cost of Consumed, we need to understand what is happening in the raw materials area.

In the Raw Material area, we purchase and stock raw material, and then supply the necessary raw material to the WIP area for converting to WIP.

Here we cab use the general formula for COGS directly

Cost of Raw material Consumed = 

Opening stock of Raw Material + Purchase Of Raw Material - Closing stock of Raw Material. (FORMULA E)


COST OF FINISHED GOODS SOLD  (A+B+C+D+E)

Cost of finished goods sold = (4) Opening stock of finished goods + (3) Opening stock of WIP + (1) Cost of Raw material consumed  - (7) Closing stock of finished goods - (6) Closing stock of WIP + (9) Manufacturing Overheads  (FORMULA F)

Now,  the formula for Cost of finished goods sold component of Formula No 2 is complete. Now we have to add the formula for Cost of stock in trade, Cost of Stores and spares ( including packing materials) consumed, to Formula F and Other Adjustments.

COST OF STOCK IN TRADE

Now we need to understand that a manufacturing company also trades goods, which either they do not manufacture. This means that they purchase finished goods (which they do not manufacture), stock them and sell them in the market, just like a trading company. These kind of goods are called stock in trade.

So they account for the inventory of  stock in trade, just like trading companies do.

So by using the general formula for the COGS

Cost of Stock in trade = Opening stock of Stock in trade + Purchase of Stock in trade-Closing stock of Stock in trade. (FORMULA G)

COST OF STORES AND SPARES AND PACKING MATERIALS

When a company manufactures goods, they consume spares, packing materials  as well as items in stores. The accounting for the cost of stores, packing materials and spares varies from company to company. Either they diclose the cost right away, in a different head, or they include the opening and closing stock along with raw materials, or with the finished goods. 
                                   

STOCK ADJUSTMENTS DUE TO MERGERS AND ACQUISITIONS

During mergers and acquisitions, the stock of the merged or the acquired company may be added to the opening stock and closing stock of the Raw materials, WIP and finished goods, in the year of the merger and acquisition, Normally, they are disclosed separately. 

OTHER ADJUSTMENTS

I will add the cases for other adjusments later.


CONCLUSION

FORMULA No 2 to FORMULA No 1


Let us write down the FORMULA F again

Cost of finished goods sold = (4) Opening stock of finished goods + (3) Opening stock of WIP + (1) Cost of Raw material consumed  - (7) Closing stock of finished goods - (6) Closing stock of WIP + (9) Manufacturing Overheads  (FORMULA F)

Merging formula G to Formula F and adding the additional costs of Stores, packing materials and spares, Stock adjustments due to mergers and acquisitions, and other adjustments

we get

Cost of  goods sold = (4) Opening stock of finished goods + (3) Opening stock of WIP + (1) Cost of Raw material consumed  - (7) Closing stock of finished goods - (6) Closing stock of WIP + (9) Manufacturing Overheads + (5) Opening stock of Stock in trade + (2) Purchase of Stock in trade-(8) Closing stock of Stock in trade + (10) Cost of Stores and spares ( including packing materials) consumed+ (11) Stock adjustments due to mergers and acquisitions + (12) Other adjustments.

So we have successfully assembled all the components of Formula No 1 by expanding Formula No 2

Accounting for unclaimed cash dividend

Lets start with an example. 

A company had 100000 shares outstanding (par value of Rs 1). The company plans to declare a 1:1 dividend. 

The following entry is made at the closure of financial statements

Provision for proposed dividend                                          100000
Appropriation to PL account                       100000

In the first quarter of the next financial year, the dividend is declared.

The entry is

Provision for proposed dividend                  100000
Dividend Payable                                                                100000


On the date of payment, the company is unable to pay a few shareholders amounting to Rs 10000, due to technical issues. 

The entry for the payment is

Dividend Payable                                        100000
Unclaimed dividend                                                             10000
Cash                                                                                   90000

And another entry for earmarking the fund for unclaimed dividend

Cash earmarked for  unclaimed dividend         10000
Cash                                                                                    10000

Wednesday 1 March 2017

How Provisions and Contributions for Employee benefits is recorded.

PROVISIONS FOR EMPLOYEE BENEFITS

I am going to explain this in a simple manner. Provisions are required in defined benefits pan. Defined benefits, are estimates of expenses that has to be paid to the employees. Since they are estimates, they are provided for (provisions) in the balance sheet. Provisions for Gratuity, leave encashment are examples. 

There are two kinds of provisions for employee benefits that needs to be recorded by a company.

Short term provisions.

                       Short term provisions are quite simple to record. They are liabilities which are due to employees within a years time. Lets take a look at the entry for a short term provision.

 Employee benefit expense                   XXX
 Provision for Employee benefit                                  XXX

We do not need a separate fund for paying for these provisions, as they come under current liabilities.

Long term provisions.

                       Long term provisions are provisions estimated and recorded every year in anticipation of a lump sum payout to employees, when they retire, or when they complete the tenure required for availing the benefit. There are various methods used for estimating the long term liability to the company for these lump sum payments. Lets look into an example.

Company XYS Ltd  gives salary to an employee of 10000 per year. He is eligible to retire after 5 years with a gratuity of 10% of his last annual salary multiplied by the years of his service to the company. 

The company estimates a salary rise of 10% each year. 

His last year salary can be estimated as 10000 X (1.1)^5 = 16105

So the company will have to pay him 5 X 16105 X 10% = 8052.5 when he retires.

For this the company has to make a provision each year till he retires. 

For that the company divides 8052.5 by 5 and multiplies by the present value factor to obtain the estimate for the provision for each year. 

For year 1, year 2, year 3, year 4 and year 5  the provision estimate is calculated as 1099, 1209, 1330, 1464 and 1610. Along with that, some other costs are added such as interest costs and other costs. Now the provisions are increased to say 1500, 1750, 2000, 2250, and 2500. The entry for provisions for each year will be

Year 1

Employee gratuity expense                   1500
Provision for Employee gratuity                                  1500

Investments                                           1500
Cash                                                                              1500

Year 2

Employee gratuity expense                   1750
Provision for Employee gratuity                                  1750

Investments                                           1750
Cash                                                                              1750

Year 3

Employee gratuity expense                   2000
Provision for Employee gratuity                                  2000

Investments                                           2000
Cash                                                                              2000

Year 4

Employee gratuity expense                   2250
Provision for Employee gratuity                                  2250

Investments                                           2250
Cash                                                                              2250

Year 5

Employee gratuity expense                   2500
Provision for Employee gratuity                                  2500

Investments                                           2500
Cash                                                                              2500

Note that an equivalent amount of investments is done each year. Some companies do not make investments,but rather manage the expenses by insuring for the same.

Along with these expenses, additional expenses such as acturial Gain/loss, Gain/ Loss from Investments, and Actual settlements/ curtailments is charged to income statement each year.

CONTRIBUTIONS TO EMPLOYEE BENIFITS

These are contributions done by companies on monthly basis for future payments to the employees. The amount for these contributions are know to the company, so there is no need for any provisions. Which is why they come under defined contributions plan. They are recognized in Profit and loss as expenses.  Contributions to provident fund and superannuation are examples.

The entry for a contribution is


Contribution to PF/ Superannuation               XXX
Payables/cash                                                                                      XXX


Friday 27 January 2017

Du Pont Analysis Simplified with an Example


The simplified formula for Du Pont analysis is shown below.


Before we go deeper we need to clarify each term used in the above formula.

RETURN ON EQUITY 

Return on Equity (ROE) basically, is the return from a business, as seen from the owners perspective. It shows what percentage of equity (Shareholder's equity or Owner's capital), the net profit is.

So ROE= Net profit/ Average shareholders equity.

Now we use average shareholders equity due to the fact that the shareholders equity can increase (or decrease) through out the course of the running financial year. For calculating average shareholders equity, we find the average of the beginning and ending balance of the shareholders equity account. It will be more clear in the example given to illustrate the idea.

NET PROFIT MARGIN

The net profit margin gives an idea of what percentage of total revenue, the net profit is. The concept will be clearer in the given below example.

ASSET TURN OVER RATIO

This ratio basically gives an idea of  how many times the assets of a company is turned over through the revenue of a business( sales or service).

Asset Turn over ratio = Total Revenue/ Average total assets

We take the average total assets due to the fact that the total assets can increase (or decrease) through out the course of the running financial year. For calculating average total assets, we find the average of the beginning and ending balance of the total assets. It will be more clear in the example given to illustrate the idea.

Now we know that the basic accounting equation is
                                                                          ASSETS = LIABILITIES + EQUITY

                                                               OR      ASSETS= TOTAL INVESTMENT
So the asset turn over ratio can also be seen as how many times the total investment is turned over in order to milk out profits.

Therefore

                ASSETS TURN OVER RATIO = TOTAL INVESTMENT TURN OVER RATIO

FINANCIAL LEVARAGE

As you can see, Financial leverage in the du pont formula is given as the ratio of Average total assets and the shareholder's equity,

And we know that the basic accounting equation  is

                                                                          ASSETS = LIABILITIES + EQUITY

                                                         Financial Leverage = Average total Assets/ Equity
           
                                                                                         = ( LIABILITIES + EQUITY )/ EQUITY

Which means financial leverage gives an idea of how much the business is jacked up with liabilites.
The more the liability, the more the leverage is.

DU PONT ANALYSYS

Let us recap the du pont formula

      ROE = NET PROFIT MARGIN X  ASSET TURN OVER RATIO X  FINANCIAL LEVERAGE

Now let us continue with an example to understand how du pont formula is used to analyse the perfomance of a business, from an owners perspective.

John invests 10000 in a bakery and buys raw material, display racks, baking machinery for 8000 and is left with cash of 2000.

For the first year,
                          the Cost of raw materials = 7500
                                          Other expenses = 2000
                                      and Sales revenue = 10000

From the above we can see that

                               The net profit margin  = Net profit/ Total Revenue
                                                                    = (10000-9500)/10000 =5%
                                                          ROE = Net profit/Equity
                                                                   = (10000-9500)/10000= 5%

Now in the 5th year of business, John had invested an additional amount of 10000 into the business over the years, he had purchased additional equipment, employed a salesperson, introduced new items, increased the efficiency of baking . He could increase the sales revenue to 20000, but the raw material cost and other expenses also increased to 13500 and 3500 respectively, for the 5th year.

For the 5th year John calculated
                               The net profit margin  = Net profit/ Total Revenue
                                                                   = (20000-17000)/20000 =15%
                                                        ROE = Net profit/Equity
                                                                  = (20000-17000)/20000 =15%

As he completed 5 years of business, John learned that he could not increase the ROE beyond 15% while, another bakery in the same area had an ROE of 25%. On studying the methods of the other bakery, John came to know that the sales revenue of the other bakery was 25000, with the same investment of 20000. In order to increase the sales revenue, John tied up with a local supermarket for selling his items.

 In the 6th year, raw material costs increased to 16750, and other expenses to 4500. But the sales revenue increased to 25000.

he calculated
                               The net profit margin  = Net profit/ Net revenue
                                                                   = (25000-21250)/25000 =15%
                                                          ROE = Net profit/Equity
                                                                   = (25000-21250)/20000 =18.75%

At the end of 6th year,John learned two important lessons

1. He could not increase the net profit margin easily. He knew that the industrial standard for net profit margin is around 15%. He had to find another way to increase the ROE.

2. By increasing the sales revenue with respect to the investment, he could increase the ROE even when the net proft margin remained the same. This lead him to asset turnover ratio. Total revenue/ Total Investment is nothing but the asset turn over ratio as we had seen earlier.

in the 6th year

                              Asset Turn over ratio = Total revenue/ Avg Total Assets
                                                                 = Total revenue/ Total Investment
                                                                 = 25000/ 20000 = 1.25
So John understood that by turning over the assets which is equal to the total investment, by 1.25 times in the 6th year, he could increase the ROE to 18.75%.

Now John knew that he cannot increase the net profit margin farther than 15%, without compromising on the quality of raw materials or the methods of preparation or by reducing any other costs as he was already running a lean business. So he has to revert back to the method of further increasing the turnover ratio by increasing the sales revenue. The only way to do that was to go for home delivery. But for that, he would need to buy a delivery van. And a delivery van would require an investment of another 10000. But he could only put up that amount by taking a loan. So in the 7th year, John went for a loan of 10000, with an interest expense of 1000 per annum.

This increased the sales revenue to 40000, with a commensurate increase in raw materials to 25000 and other expense to 9000 and interest expense of 1000.
       
he calculated for the 7th year
                           
                               The net profit margin  = Net profit/ Total revenue
                                                                   = (40000-35000)/40000 =12.5%
                                                        ROE = Net profit/Equity
                                                                  = (40000-35000)/20000 = 25%
                                Asset Turn over ratio = Total revenue/ Avg Total Assets
                                                                   = Total revenue/ Total Investment
                                                                   = 40000/ 30000 = 1.33

                                        Leverage Ratio  = Avg total Assets/ Equity
                                                                  = Total Investment/ Equity
                                                                  = 30000/20000 = 1.5

                                DUPONT Analysis

                                                        ROE = Net profit Margin X Turn over ratio X Leverage
                                                                 = 12.5 X 1.33 X 1.5
                                                                 = 25

So from 7 years of John's bakery business, we can learn the following

1. ROE will be equal to Net Profit Margin, if a business could turn the investment only one time, ie the turn over ratio=1, and if there is no leverage.

2. Even if there is no leverage, the ROE can be increased by turning over, the total investment, more than one time with the same profit margin.

3. Leverage is the most tricky one here. First of all, all loans have interest, and this additional expense will bear on the profit margin.

 Secondly, the leverage increases the total investment, which would decrease the turn over ratio, if the sales revenue does not increase, commensurately. In other words, if the additional fund brought in by taking a loan is put idle, the sale revenue won't increase, on the top of it, the Total Revenur/assets will decrease, which will bring down the turn over ratio. The leverage multiplier won't be enough to jack up the ROE. This will be more clear in John's example.

In the 7th year John had brought in additional 10000 from a loan.

                           The Leverage = Total investment/ Equity
                                                  = 30000/20000
                                                  =1.5

Imagine if John went crazy and put all the 10000 loan fund in a safe deposit box, keeping it idle. He would not be able to purchase the delivery van. The sales revenue would remain same as that of the 6th year at 25000. The Raw material costs would be same as 16750, and other expense 4500. On top of it he would have to incur an interest expense of 1000.

              The Net profit Margin = Net Profit/Total Revenue
                                                  = (25000-22250)/25000
                                                  = 11%
                                 The ROE  = Net Profit/Equity
                                                  = (25000-22250)/20000
                                                  = 13.75%
Had he not taken the loan the ROE would be 18.75%

In order to see what really went wrong, we need to see the du pont analysis

                The Turn over ratio  = Total Revenue/ Avg Total assets
                                                 = Total Revenue/ Total investment
                                                 = 25000/ 30000
                                                 = 0.83
Dupont Analysis

                                The ROE  = Net Profit Margin X Turn Over Ration X Leverage
                                                 = 11 X 0.83 X 1.5
                                                 = 13.75%
                                         
So what we learn from all this is that even though the company is leveraged, it may not produce decent ROE, if the fund from the leverage loan, is not utilized efficiently.

CONCLUSION

Du Pont analysis gives precious insight to the efficiency of  capital management and operational performance of a business, from an investor/ owners perspective. It allows us, not only to compare how leverage is used to enhance the profit of a company, but also to individually compare the net profit margin and the turn over ratio with other competitors in the industry. It allows us to judge if the capital structure justifies, the operational requirement of funds in a business.


Wednesday 11 January 2017

ESOP Accounting Case study of Dabur Limited

Please see the post titled Warrants and Employee Stock Options to understand the basic concepts

Note that I have changed certain notations used in my previous post on warrants and employee stock options, in order to conform to those used in the Consolidated Financial Statements of Dabur Limited. For this case study, I have used the statements for 2011-12

Terms changed

1. Paid in Capital in Excess of Par          to Share Premium
2. Common Stock                                  to Total Shares Issued for ESOP
3. Paid in Capital-ESOP                         to ESOP Scheme Outstanding


I don't need to emphasize the need for ESOP schemes in a growing company. But as we will see, ESOPs incur a cost on the company, specifically on it's shareholders. The following is disclosed in the 2011-12 report of the company.

1. Number of Options granted                    : 1557412
2. Pricing formula : Each option carries the right to the holder to apply for one equity share of the           Company at par/discount to market value.
3. Options vested                                      : 1377056
4. Options exercised                                  : 1377056
5. Total number of shares arising as a result of exercise of option
                                                                : 1377056
6. Options lapsed/cancelled                         : 1520376
7. Variation in terms of options                   : None
8. Money realized by exercise of options      : Rs. 672721/-
9. Total number of options in force              : 18287210


The fair value of the options under intrinsic value method is 111.90 as mentioned in the AR. Fair value under this method is the difference between the exercise price and the market price of the share at that time. We can also use the Black scholes Model for evaluating the options.

The formula used for recording the cost of the options based on the intrinsic value method  in the balance sheet is as follows

The maximum of

1.  (Fair value of options   MINUS  a percentage of market price of the shares) x no of options granted.
2.  (Fairvalue of options X no of options granted) MINUS (a percentage of total empoyee compensation for that year)
3. Zero.

So when the options are granted, they are recorded using the above formula, as per indian accounting standards. From the balance sheet, we can find that the options granted in the year 2011-12, is recorded at a cost of 928 lacs. And we can find that the cancelled options is recorded at a total of 802 lacs.

Options are a liability to the company. But they are also long term liabilities. The opposite entry will naturally be a capitalised expense, which will be amortized over the life of the options.

The following is the journal entry for granting options

Deferred  ESOP Scheme Outstanding expense           928
ESOP Scheme Outstanding liability                                                   928

As you can see, the expense for the liability is deferred, which makes it a capitalized asset. This asset can be found under non current assets in the balance sheet. The entry for cancelled options is as follows.

Deferred  ESOP Scheme Outstanding expense                                    802
ESOP Scheme Outstanding liability                          802                              

This capitalised asset, needs to be amortized over the life of the options. The balance in the Deferred  ESOP Scheme Outstanding expense  account at the beginning  is Rs 8295 lacs. the amortization entry is as follows.

Amortization Expense                                              3037
Deferred  ESOP Scheme Outstanding expense                                    3037

The balance in the ESOP Scheme Outstanding liability account is Rs 11681 lacs at the beginning. This was accumulated over time, This liability gets reduced only when the options gets exercised.

The total no of options exercised is 1377056. An equivalent amount of share is issued in leu of the options exercised ie 1377056. The value of the options exercised is 1219 lacs, which is calculated using the formula mentioned above that conforms to Indian Accounting standards. The weighted average exercise price (per option) is Rs 50.90. So the company should receive a cash of
1377056 X 50.90 = 700.9 lacs from the employees for exercising the options. But it has received only
Rs 672721/- in total, which is only Rs 0.48/- per options. I don't know the terms and conditions of ESOP scheme at Dabur Limited, but this seems an excess amount of compensation to the employees, especially to the promoters, who are also directors on the board.

For the year 2011-12, the average price of shares was Rs 100/-. The total benefit for the employees under ESOP scheme = (100 X 1377056)-672721=13.7 crore. This is in additional to all other salaries and remunerations.


The journal entry for options exercise is as follows

Cash                                                                        7
PL Account                                                              7
ESOP Scheme Outstanding liability                           1219
Total Shares issued for ESOP                                                                14
Share Premium                                                                                  1219

For the company there was also a transition adjustment of 79 lacs in the ESOP Scheme Outstanding liability account. This is a one time compliance adjustment and can be ignored.

The summary of the ESOP Scheme Outstanding Liability account is as follows

                                          ESOP Scheme Outstanding
Previous Year Balance 11681
Addition during this year 928
Allotted during this year -1219
Cancellation during this  year -802
Transition Adjustment -79
End of Year Balance 10509

The Summary of Deferred  ESOP Scheme Outstanding expense account is as follows

                                    ESOP Scheme Outstanding expense account

Previous Year Balance 8295
Addition during the year  928
Less : Cancelled during the year  -802
Less: Amortised during the year -3037
End of Year Balance 5384

The issue of 14 lac shares is financed partly from PL account and partly with cash received from employees. The irony is that even the par value of Rs 1 per share is not paid for by the employees and had to be partly financed from PL Account.

The liability of ESOP Scheme Outstanding is reduced by 1219 lac and the shareholder's equity of share premium is increased by the same amount. This equity is created from charging the profit of the company regularly through amortization. This is equivalent to siphoning retained profits (surplus) to create the liability first, and then the equity, as the options are exercised.